What: Collection of programming tasks in different languages
Why: Learning programming paradigms
How: Visit: Rosetta Code
Pythagorean triples: Do it right
What: Minimal lines of code for calculating the length of integer-sided right triangles with a side length below a given threshold
Why: Functional programming paradigm and vector handling in different languages
How: Write minimal examples for: Frege, Java, SQL, R, Python, Javascript. Please contribute!
Last week I went to a talk, where Frege was introduced. Frege is a purely functinal language based on Haskel. I once looked at Haskell and the introductory example was the famous pythogorean triples. Thats also mentioned on the Frege page. I was asking myself: How can this be done in Java, or R or SQL?
Here is my list of implementations. Please contribute if you know more or have a better (shorter) version. Line breaks are inserted for better layout. All implementations return something like:
(3, 4, 5)
(4, 3, 5)
(6, 8, 10)
(8, 6, 10)
Frege
This is not tested. I am not sure, what Frege says about the inserted line breaks.
1 2 3 4 5 | [ (a,b,c) | a <- [1..10], b <- [x..10], c <- [x..10], a*a + b*b == c*c ] |
Java
Tested.
For the Java version: Lets create a model class first. This makes the stream handling more easy. It is just some sugar.
1 2 3 4 5 6 7 8 9 10 11 12 | static class Triple { final int a, b, c; public Triple(int a, int b, int c) { this.a=a;this.b=b;this.c=c; } @Override public String toString() { return "Triple [a=" + a + ", b=" + b + ", c=" + c + "]"; } } |
Now, lets write the logic:
1 2 3 4 5 6 7 | IntStream intStream = IntStream.range(0, 1000); intStream.boxed().map(number -> new Triple( (number/100)%10+1, (number/10)%10+1, (number/1)%10+1)). filter(triple -> Math.pow(triple.a, 2)+Math.pow(triple.b, 2)==Math.pow(triple.c, 2)). forEach(triple -> System.out.println(triple)); |
SQL (Oracle)
Tested.
1 2 3 4 5 | SELECT a, b, c FROM (SELECT Level AS a FROM Dual CONNECT BY Level <=10), (SELECT Level AS b FROM Dual CONNECT BY Level <=10), (SELECT Level AS c FROM Dual CONNECT BY Level <=10) WHERE POWER(a, 2)+POWER(b, 2)=POWER(c, 2) |
R
Tested.
1 2 3 | df=data.frame(a=1:10, b=1:10, c=1:10) expanded=expand.grid(df) subset(expanded, a**2+b**2==c**2) |
Python (3)
Tested.
1 2 3 4 5 6 | import itertools triples = [range(1, 11), range(1, 11), range(1, 11)] valid=filter( lambda t: t[0]**2+t[1]**2==t[2]**2, list(itertools.product(*triples))) print(*valid, sep="\n") |
Javascript
Tested.
Creation of filled arrays: See here.
Integer division: See here.
1 2 3 4 5 6 7 8 | var numbers=Array.apply(null, {length: 1000}).map(Number.call, Number); var triples=numbers.map(function(n){ return {a: ~~(n/100)%10+1, b: ~~(n/10)%10+1, c: ~~(n/1)%10+1} }); var valid=triples.filter(function(t){ return Math.pow(t.a,2)+Math.pow(t.b,2)==Math.pow(t.c,2) }); console.log(valid); |
Fly me to the stars: Interactive graphs with Docker, Jupyter and R
What: Documented data analysis on the fly
Why: Keep documentation, implementation and operation in one document; create publication ready reports; explore data interactively
How: Use Docker (containerization), Jupyter (documenting and code execution), R (analysis) and Plotly (interactive plots, very interesting also for web-frontend Javascript graphs)
You have to install Docker to run this tutorial. All dependencies are automatically installed in the container. Otherwise, you have to install the dependencies manually. Additionally, you need a browser to get access to Jupyter. The interactive plots work best in Chrome. I had some issues running it with firefox.
Copy the following content in a file called Dockerfile:
1 2 3 4 5 6 7 8 9 10 11 12 13 14 15 16 17 18 19 20 21 22 23 24 25 26 27 28 29 30 31 32 33 34 35 36 37 38 39 40 41 42 43 44 45 46 47 48 | FROM ubuntu:xenial RUN apt-get update RUN apt-get install -y wget RUN apt-get install -y bzip2 # Install python RUN wget https://3230d63b5fc54e62148e-c95ac804525aac4b6dba79b00b39d1d3.ssl.cf1.rackcdn.com/Anaconda3-4.0.0-Linux-x86_64.sh && bash Anaconda3-4.0.0-Linux-x86_64.sh -b -p $HOME/anaconda # Install R RUN apt-get install -y r-base RUN apt-get install -y r-recommended # Install requirements for Jupyter RUN apt-get install -y libzmq3-dev # See http://askubuntu.com/a/628288 RUN apt-get install -y libcurl4-openssl-dev RUN apt-get install -y libssl-dev RUN apt-get install -y inkscape RUN apt-get install -y pandoc RUN apt-get install -y texlive-latex-base RUN apt-get install -y texlive-latex-extra # Prepare R and Jupyter. ADD installJupyter.R /root/installJupyter.R RUN export PATH="$HOME/anaconda/bin:$PATH" && R CMD BATCH /root/installJupyter.R RUN export PATH="$HOME/anaconda/bin:$PATH" && jupyter notebook --generate-config # Allow all clients to connect. THIS IS NOT SECURE! RUN sed -i s/.*NotebookApp\.ip.*localhost.*/c.NotebookApp.ip=\'*\'/g ~/.jupyter/jupyter_notebook_config.py RUN mkdir /root/jupyternotebooks # Set the locale (german) RUN echo >> /etc/locale.gen de_DE.UTF-8 UTF-8 RUN echo >> /etc/locale.gen de_DE ISO-8859-1 RUN echo >> /etc/locale.gen de_DE@euro ISO-8859-15 RUN locale-gen RUN echo "Europe/Berlin" | tee /etc/timezone RUN dpkg-reconfigure --frontend noninteractive tzdata # Taken from: http://jaredmarkell.com/docker-and-locales/ and adapted #RUN apt-get update && apt-get install -y language-pack-de-base && locale-gen de_DE && echo >> ~.profile export LANG=de_DE.ISO-8859-1 ENV LANG de_DE.iso88591 ENV LANGUAGE de_DE.iso88591 ENV LC_ALL de_DE.iso88591 # Start Jupyter on port 8888 EXPOSE 8888 CMD export PATH="$HOME/anaconda/bin:$PATH" && cd /root/jupyternotebooks && jupyter notebook --no-browser |
In the same directory, you need the file installJupyter.R with the following content:
1 2 3 4 5 6 7 8 9 10 | install.packages("digest", repos="https://cran.uni-muenster.de/")
install.packages("uuid", repos="https://cran.uni-muenster.de/")
install.packages("jsonlite", repos="https://cran.uni-muenster.de/")
install.packages("base64enc", repos="https://cran.uni-muenster.de/")
install.packages("evaluate", repos="https://cran.uni-muenster.de/")
install.packages("dplyr", repos="https://cran.uni-muenster.de/")
install.packages("stringr", repos="https://cran.uni-muenster.de/")
install.packages("plotly", repos="https://cran.uni-muenster.de/")
install.packages(c("rzmq","repr","IRkernel","IRdisplay"), repos = c("http://irkernel.github.io/", "https://cran.uni-muenster.de/"), type = "source")
IRkernel::installspec() |
Now, run the following two docker commands in the same directory where the docker file is located:
1 2 | docker build -t docker-jupyter . docker run --rm -v <Path to a folder for the jupyter notebooks>:/root/jupyternotebooks -p 8888:8888 docker-jupyter |
You should now have the running docker instance available on the docker VM, port 8888:
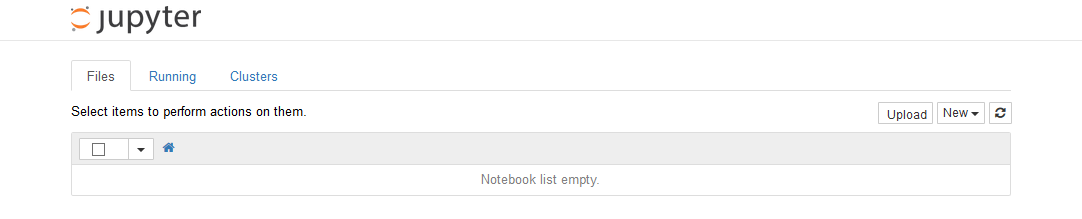
Via the „Upload“ button, upload the Notebook from here: Interactive graphs with Jupyter and R and open it. Execute all steps via „Cell“ -> „Run all“. Now, it should look like:
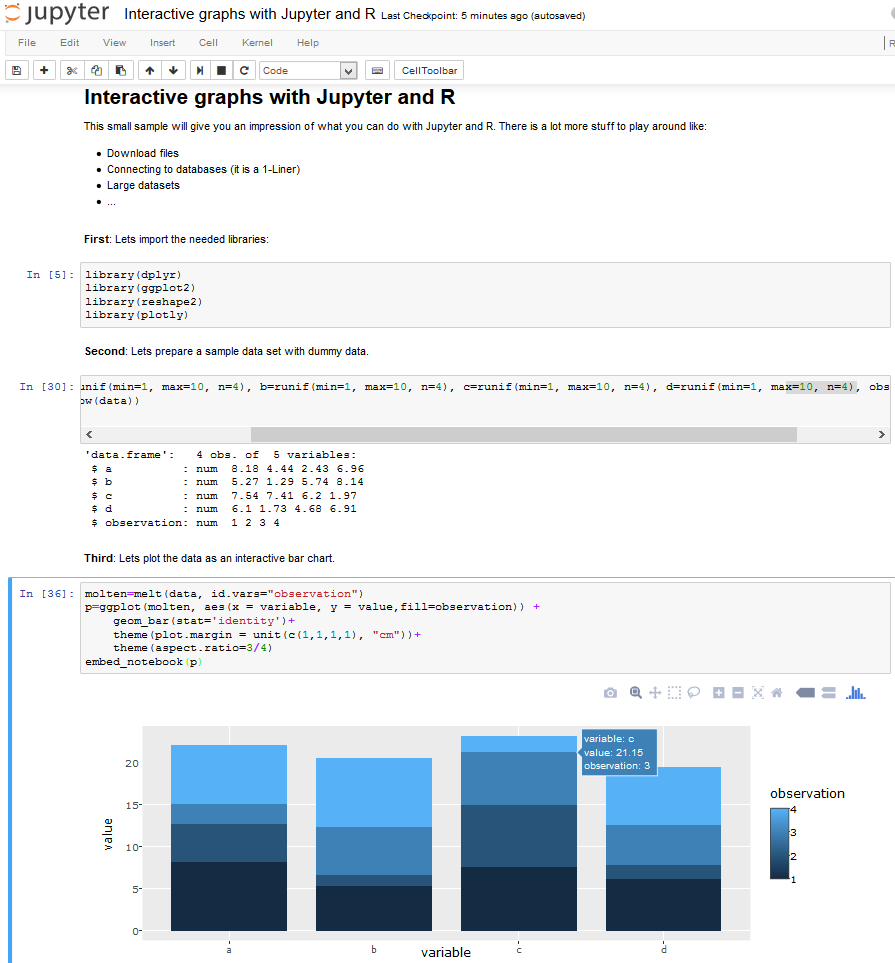
Did you noticed the interactive plot? You can zoom, export as png, have tooltips, … All without anything to programm. Cool, isn’t it?
Ok. Your customer is impressed but does not like the modern html stuff? He wants to print it out and send it away via mail? No problem. Just change the interactive plots to none-interactive ones and export to pdf via „File“ -> „Download as“ -> „PDF via Latex“ (that ’s why the docker file above contains all the stuff like pandoc, latex, …). You will get nearly publication ready report out.
Win a card game against your kids with OCR and statistics
What: OCR & R; Analyze standardized hardcopy forms electronically
Why: Win a card game with a lot of cards to remember (car quartett)
How
You need:
- The card game
- A scanner
- Gimp
- A linux machine
- An hour free time
1. Setup a virtual machine or an existing linux
I used Ubuntu Xenial64bit. Maybe, you have to adapt the steps a little bit.
- Install tesseract
-
1
sudo apt-get update
-
1
sudo apt-get install -y tesseract-ocr tesseract-ocr-deu
-
- Install Java
-
1
sudo apt-get install -y openjdk-8-jdk
-
2. Scan the cards
Scan all the cards. Make one image per card. Make sure, you placed the cards all the time at the same position in the scanner (for example upper right corner). All images should have the same resolution and size. Thus, the same regions on the image should correspond to the same region in all the cards (for example a name field). The cards can look like this (you can guess what game I played ;-)):

You have to tweak the images a little bit to get good OCR results. Here is what I did:
- Use Gimp to blur the images (Filter ⇒ Blur ⇒ Blur)
3. Basic image processing with Java & tesseract
The cards I scanned had some defined regions with numerical or text values (see figure above). You can enhance the OCR results dramatically, if you know ehere to look for the text. Create a small class containing the information about each region. This class should also contain a flag if you look for text or numerical values.
1 2 3 4 5 6 7 8 9 10 11 12 13 14 15 16 17 | public class ImageInfo { public final String name; public final boolean number; public final int leftUpX; public final int leftUpY; public final int rightDownX; public final int rightDownY; public ImageInfo(String name, boolean number, int leftUpX, int leftUpY, int rightDownX, int rightDownY) { this.name = name; this.number = number; this.leftUpX = leftUpX; this.leftUpY = leftUpY; this.rightDownX = rightDownX; this.rightDownY = rightDownY; } } |
Set up the regions for your image as you like. Thats what I used for the cards (coordinates are pixels in the scanned image).
1 2 3 4 5 6 7 8 9 | final static List infos = Arrays.asList(new ImageInfo[] { new ImageInfo("Name", false, 160, 158, 460, 40), new ImageInfo("Geschwindigkeit", true, 200, 685, 70, 35), new ImageInfo("Hubraum", true, 460, 685, 110, 40), new ImageInfo("Gewicht", true, 180, 790, 110, 40), new ImageInfo("Zylinder", true, 475, 790, 60, 40), new ImageInfo("Leistung", true, 200, 895, 70, 40), new ImageInfo("Umdrehung", true, 470, 895, 90, 40) }); |
Now, process each image. For each image I did the following steps:
- Read in the image
1
BufferedImage image= ImageIO.read(imageFile);
- Transformed image to black/white ⇒ Better OCR results
1
2
3
4
5
6
7
8
9
10
11
12
13
14
int width = image.getWidth();
int height = image.getHeight();
for (int y = 0; y < height; y++) {
  for (int x = 0; x < width; x++) { int rgb = image.getRGB(x, y); int blue = rgb & 0xff; int green = (rgb & 0xff00) >> 8;
    int red = (rgb & 0xff0000) >> 16;

    if(red>210&&blue>210&&green>210){
      image.setRGB(x, y, new Color(0, 0, 0).getRGB());
    }
    else{
      image.setRGB(x, y, new Color(255, 255, 255).getRGB());
    }
  }
}
- Do some basic clipping to extract one image for each region on the card you are interested in. Start tesseract for each image.
1
2
3
4
5
6
7
8
9
10
11
12
13
14
15
16
for (ImageInfo imageInfo : infos) {
  File outputFile = "the output png file, should be in the same directory for the same cards";
  ImageIO.write(image.getSubimage(imageInfo.leftUpX, imageInfo.leftUpY, imageInfo.rightDownX, imageInfo.rightDownY), "png", outputFile);
  ProcessBuilder processBuilder;
  // -psm 6 works best for my case of one line of text in each image. Remember: each image contain ONE numerical or text value from the card.
  if(imageInfo.number){
    // Restrict tesseract to digits.
    processBuilder = new ProcessBuilder("tesseract", "-psm", "6", outputFile.toString(),
      path.resolve(outputFileNameBase + "_"+imageInfo.name).toString(), "digits");
  }
  else{
    processBuilder = new ProcessBuilder("tesseract", "-psm", "6", outputFile.toString(),
        path.resolve(outputFileNameBase + "_"+imageInfo.name).toString());
  }
  processBuilder.start();
}
- Collect the results from the text file output of tesseract (or read directly from the output stream of the process). Maybe, there is also a batch mode of tesseract???
4. Analyze the results with R
Lets assume you have the results now in a list like this:
Geschwindigkeit;Gewicht;Hubraum;Leistung;Name;Umdrehung;Zylinder
120;19.000;12.800;440;Volvo FH12-440;2.200;6
...
You can read in the values easily in R with:
1 2 | # The 5th row contains the names of the cars in my example. This is used as dimension.
cards=read.csv("share/result.csv", sep=";", header=T, row.names=5) |
This is read in as a data frame. You can get a first impression of the best values with the summary function:
1 | summary(cards) |
Write a simple function to get the values for all categories:
1 2 3 | bestCandidates=function(attribute){
subset(cards, cards[attribute]==max(cards[attribute], na.rm=T))
} |
And apply it:
1 2 | dimensions=names(cards) lapply(dimensions, bestCandidates) |
And voila: You have to remember just a few cards with the highest values. Next time I ask for „Zylinder“ in case Ihave the „Scania R620“.
1 2 3 | [[6]]
Geschwindigkeit Gewicht Hubraum Leistung Umdrehung Zylinder
Scania R620 125 26 15.6 620 1.9 8 |
Http-Server for jersey app with Java standard tools
What: Create a simple http server for a jersey app without traditional application servers.
Why: Kiss & useful for micro services
How: Use built-in java classes
Download the following dependencies (or include them in your pom.xml):
1 2 3 4 5 6 7 8 9 10 11 12 13 14 15 | <dependency> <groupId>org.glassfish.jersey.core</groupId> <artifactId>jersey-server</artifactId> <version>2.25.1</version> </dependency> <dependency> <groupId>org.glassfish.jersey.containers</groupId> <artifactId>jersey-container-jdk-http</artifactId> <version>2.25.1</version> </dependency> <dependency> <groupId>org.glassfish.jersey.media</groupId> <artifactId>jersey-media-json-jackson</artifactId> <version>2.25.1</version> </dependency> |
7-line Java way, minimal
1 2 3 4 5 6 7 | ResourceConfig resourceConfig = new ResourceConfig(); resourceConfig.packages("mandelbrot"); String hostName = "localhost"; try {hostName = InetAddress.getLocalHost().getCanonicalHostName();} catch (UnknownHostException e) {e.printStackTrace();} URI uri = UriBuilder.fromUri("http://" + hostName + "/").port(PORT).build(); JdkHttpServerFactory.createHttpServer(uri, resourceConfig); |
Usually, you need a little bit more like:
- Cors support
- Jackson
- Logging
Create the following class:
1 2 3 4 5 6 7 8 9 10 11 12 13 | /** * See: http://stackoverflow.com/a/28067653 * */ public class CORSFilter implements ContainerResponseFilter { @Override public void filter(ContainerRequestContext request, ContainerResponseContext response) throws IOException { response.getHeaders().add("Access-Control-Allow-Origin", "*"); response.getHeaders().add("Access-Control-Allow-Headers", "origin, content-type, accept, authorization"); response.getHeaders().add("Access-Control-Allow-Credentials", "true"); response.getHeaders().add("Access-Control-Allow-Methods", "GET, POST, PUT, DELETE, OPTIONS, HEAD"); } } |
Add the following lines:
1 2 | ResourceConfig resourceConfig = new ResourceConfig(); resourceConfig.packages("mandelbrot"); |
Full example:
1 2 3 4 5 6 7 8 9 10 11 12 13 14 15 | ResourceConfig resourceConfig = new ResourceConfig(); resourceConfig.packages("mandelbrot"); resourceConfig.register(JacksonFeature.class); resourceConfig.register(CORSFilter.class); String hostName = "localhost"; try { hostName = InetAddress.getLocalHost().getCanonicalHostName(); } catch (UnknownHostException e) { e.printStackTrace(); } URI uri = UriBuilder.fromUri("http://" + hostName + "/").port(PORT).build(); JdkHttpServerFactory.createHttpServer(uri, resourceConfig); |