What: Getting power production data in a real life photovoltaic system
Why: Use real data in modelling; Use mqtt to get sensor data
How: Use mqtt, csvkit and R to get and clean the data, use command line pipeline for data processing
This is the second part of my what-the-data hackathon series. Please visit also part one.
During the hackathon, the data were provided in json format with a timestamp. We collected data for nearly two days without serious interruption. My team was looking at the power production of the photovoltaic system. We decided to gather all the data as-is and write it to disk (we were expecting <100Mb of data). We used a small python script to get the data via mqtt. After the two days we collected 2.7Mb of data for the power production (and a lot more for other sensor data), which is approx. 58.000 entries like:
b'{"value":-3724.951,"timestamp":1474813391427}'
b'{"value":-3746.143,"timestamp":1474813392417}'
You can download the file here.
We needed the data for simulation, where we simulated energy transport in the system for each second. Most of the data were already timed at seconds, but some data points were missing due to sensor failures. Nevertheless, for our simulation we needed also values for these timepoints. Luckily, the sun shine doesn’t change too fast and a simple smoothing was enough to interpolate missing values.
We wanted to process the data with R and maybe other tools. We decided to convert the data to csv and process this further. Main points of the decision were:
- Ability to put csv easily under version control (text file)
- Use the csv file in a ton of different tools
We used the following bash script to strip of characters and convert the single entries to a proper json array (assume, the raw data is in the file pv_wirk.raw and has the format described above):
1 2 3 | sed "s/^b//g" pv_wirk.raw | sed "s/'//g" | \ sed "s/$/,/g" | sed '$s/},/}/g' | \ sed 's/value":-/value":/g' | sed "1 i \[" | sed -e "\$a]" |
It does the following:
- Strips of the first character (b)
- Strips of the dash characters
- Adds a comma at the end of the line
- Removes the comma from the last line (althouh it is valid json, csvkit is a little bit picky about this)
- Inverts the data. This was needed because the produced power was send with a neative sign.
- Add a square bracket at the first line to begin the json array
- Add a square bracket at the last line to end the json array
The output of the above command is piped into csvkit and converted from json to csv:
1 | ... | csvkit -f json |
The data is now in the form:
value,timestamp
4379.872,1474707052767
4388.521,1474707053773
4393.466,1474707054770
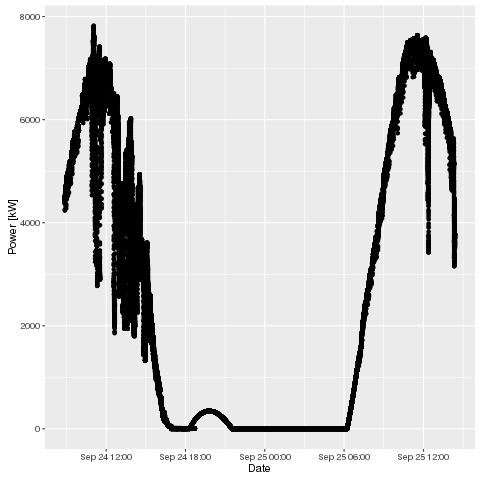
With the data in a nice csv format, we used R to plot the data and interpolate it simply by using loess smoothing. Where data were missing, we imputed it with predicted values from the loess-fit. You can find the R script here.
The resulting image is shown below. The power still shows the natural fluctuations but also contains data for each second.